
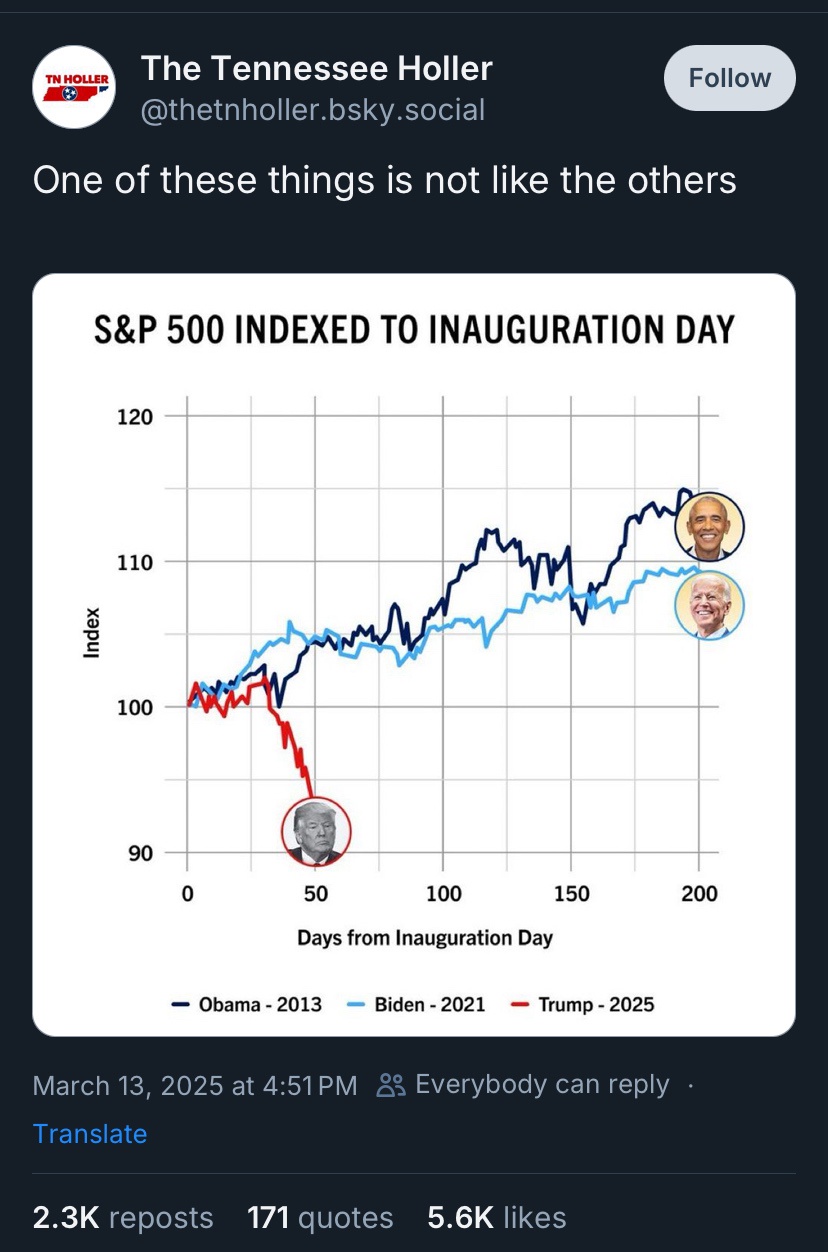
One of these things just doesn’t belong (in the White House)
Looks like we’re great again! A great big market crash that is. The yugest crash, very beautiful.
I’m too stupid to read and understand a picture, this means Tramp daddy is hurting the right people? The minority ones I don’t like?
Hell yes, brother 💪😎 All of those beta cuck minorities 🦋❄️☠️☠️ are getting FUCKED 🍆💢 I lost my job of 69 ♋ years 🏗️💩🧓 but it’s all worth it 💯 to get one mutilated trans 🌈 devil 😈 off of the little girls 👸🤤💦 sports team 🏅🎾 get those genius 🧠 hard working sigma 🍑 billionaires 🤑🧑💼💵 more of the money they deserve and so desperately need 🎰🏆 stock buybacks and shorts will siphon money where it belongs 📈 instead of in the hands 👐 of irresponsible fucks 🤡 like me 🤏 and you🫵that immediately blow 💨 all our money 💸 on dumb shit 💩 like groceries 🍎🥦🍗
Emoji pasta🥰
Where❓Is😳The👈community🏘️???
Fake. Too coherent to be MAGA ramble
Can i delete someone else’s post?
Actually yes, if you run the instance.
Is this real? I can’t wait to post it on Facebook
I want to post it to ND so bad, but I know it’ll just get removed under the no national politics rule lol
(Which isnt the worst rule TBH lmao)

Has his first term
I found some relevant graphs in my photos from his first term that are also neat:


I’d be curious how they stack up now.
To be fair COVID had a great deal to do with that
Obviously he handled COVID extremely poorly and it didn’t need to be as dramatic of a crash, but I think that factor alone was the leading reason of why that happened
Horrible colour scheme with night light filter.
It’s just a horrible color scheme regardless
Even if it’s real, Trump has been president before, and he didn’t tank the economy that time.
You mean when he had an administration that kept guard rails in place to stop him from doing the things he really wanted to do unlike this time? Yes, it was better when he wasn’t given kingly powers.
Man fails, but tries again and succeeds.
Your point?
I assume they are implying that it will be similar to the first rerm, which requires ignoring all the differences between the two.
Why cherry pick Obama’s second term?
Because of the 2008 recession, obviously, which would undercut the visual argument.
The underlying fundamentals still hold, because no one would ever argue that Obama caused the 2008 recession, while Trump did all of the work of causing the current situation himself with his dumb tariff games.
Then you get a graph that doesn’t start at zero and you can undercut the visual argument even further
Starting at 0 would actually be silly for a normalized market index value graph like this one because the market going to true 0 is not a realistic situation. Or thought of another way, this graph is essentially zero-indexed, but 0 is marked as 100 on the Y axis. 90 in this case could be thought of as -10% value and that would be perfectly accurate. These kinds of graphs are usually misleading in other ways, usually by picking specific time ranges to represent or cut off on the X axis. For instance, you could argue that the value that Trump is erasing here is largely offset by the market gains from November to January that could be arguably attributed to speculative optimism about Trump winning the election and so the crash that is shown is actually just a market correction. One might point out that triggering a market bubble and subsequent correction is no matter of pride in response to that argument, but it is there
Stocks going up mostly benefits the wealthy. We shouldn’t measure success that way.
On the other hand stocks going down have a habit of affecting the rest of us even more.
Is there any literature on this asymmetry? I thought elasticity was the same in either direction.
This is a curious one. 90% of stocks are owned by the top 10%, so stock going down would lead to less inequality. Yet the top 10% also gets to take out their anger at us.
Edit: and only 50% of American house holds have any retirement savings.
They use falling stock prices a pre text to extract extra money from peasants via the state and the stage enables them.
Most people don’t understand that this is what modern oppression looks like in the developed world. Slowly degrade quality of life over generations.
Parasite got so fat is that now they are attempting to dismantle the US federal government and getting away with it too


